AP Statistics
Units
Unit 0: All Units Inclusive
Unit 1: Descriptive Statistics and Sampling

Purchase the course to proceed
This chapter focuses on writing effective instructions, emphasizing clear and simple language, understanding the procedure, and considering the reader's perspective. It guides readers on structuring the procedure, grouping tasks, and designing instructions for better organization and readability.
This Chapter contains a Worksheet
Total Questions: 18
MCQ: 14
FRQ: 4
 Start Chapter
![]() Class Notes
Class Notes
Purchase the course to proceed
This chapter teaches the fundamentals of organizing and analyzing data. It covers differentiating between quantitative and qualitative data, utilizing various graphical methods like histograms and dot plots, and summarizing data through measures of center (mean, median) and spread (range, standard deviation).
This Chapter contains a Worksheet
Total Questions: 24
MCQ: 18
FRQ: 6
Start Chapter
![]() Class Notes
Class Notes
Purchase the course to proceed
This chapter covers bivariate statistics, specifically focusing on scatterplots, correlation coefficients, and regression analysis. It explains how to interpret scatterplots, calculate correlation, and create and interpret regression lines. The chapter also covers residual plots and how to quantify the appropriateness of a linear model using standard deviation of residuals and the coefficient of determination.
This Chapter contains a Worksheet
Total Questions: 17
MCQ: 12
FRQ: 5
Start Chapter
![]() Class Notes
Class Notes
Purchase the course to proceed
This chapter covers the fundamentals of designing research studies, including sampling methods, data production techniques like observational studies and experiments, and crucial experimental concepts like control groups and blinding. It also touches on the important distinction between generalizability and cause-and-effect relationships.
This Chapter contains a Worksheet
Total Questions: 21
MCQ: 15
FRQ: 6
Start Chapter
![]() Class Notes
Class Notes
Unit 2: Probability and Distributions
Purchase the course to proceed
This chapter introduces the concept of probability, describing it as a measure of the likelihood of an event occurring. It covers foundational topics such as sample space, events, complementary events, mutually exclusive and independent events, conditional probability, and provides practical problems to illustrate these concepts.
This Chapter contains a Worksheet
Total Questions: 21
MCQ: 15
FRQ: 6
Start Chapter
![]() Class Notes
Class Notes
Purchase the course to proceed
This chapter introduces the concept of random variables, which represent numerical outcomes of random events. It covers discrete and continuous random variables, expected value, standard deviation, and transformations. The chapter also explains binomial and geometric probability distributions, providing practical examples and calculator steps for solving related problems.
This Chapter contains a Worksheet
Total Questions: 22
MCQ: 15
FRQ: 7
Start Chapter
![]() Class Notes
Class Notes
Purchase the course to proceed
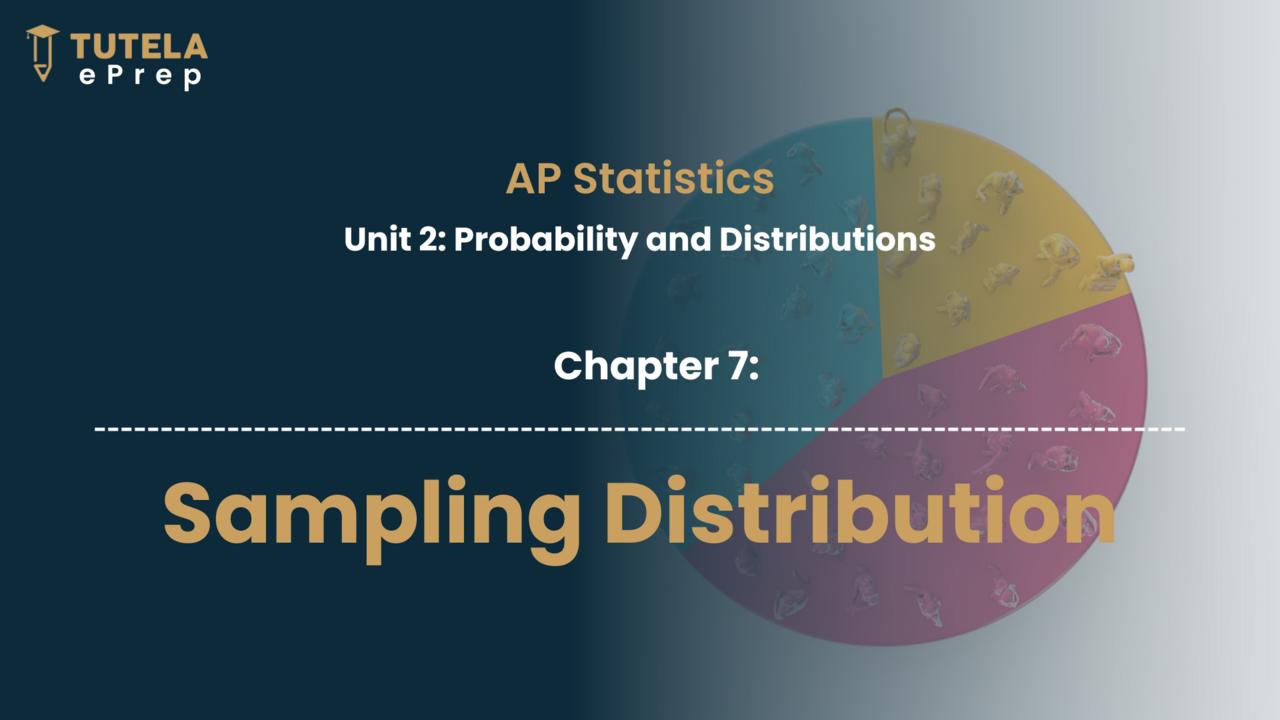
This chapter introduces sampling distribution, explaining how statistics derived from a sample can estimate population parameters. It covers the variability and probability distributions of sample statistics, including sample means and sample proportions, emphasizing conditions for normal approximation and the Central Limit Theorem. Practical examples illustrate these concepts.
This Chapter contains a Worksheet
Total Questions: 22
MCQ: 15
FRQ: 7
Start Chapter
![]() Class Notes
Class Notes
Unit 3: Inferential Statistics
Purchase the course to proceed
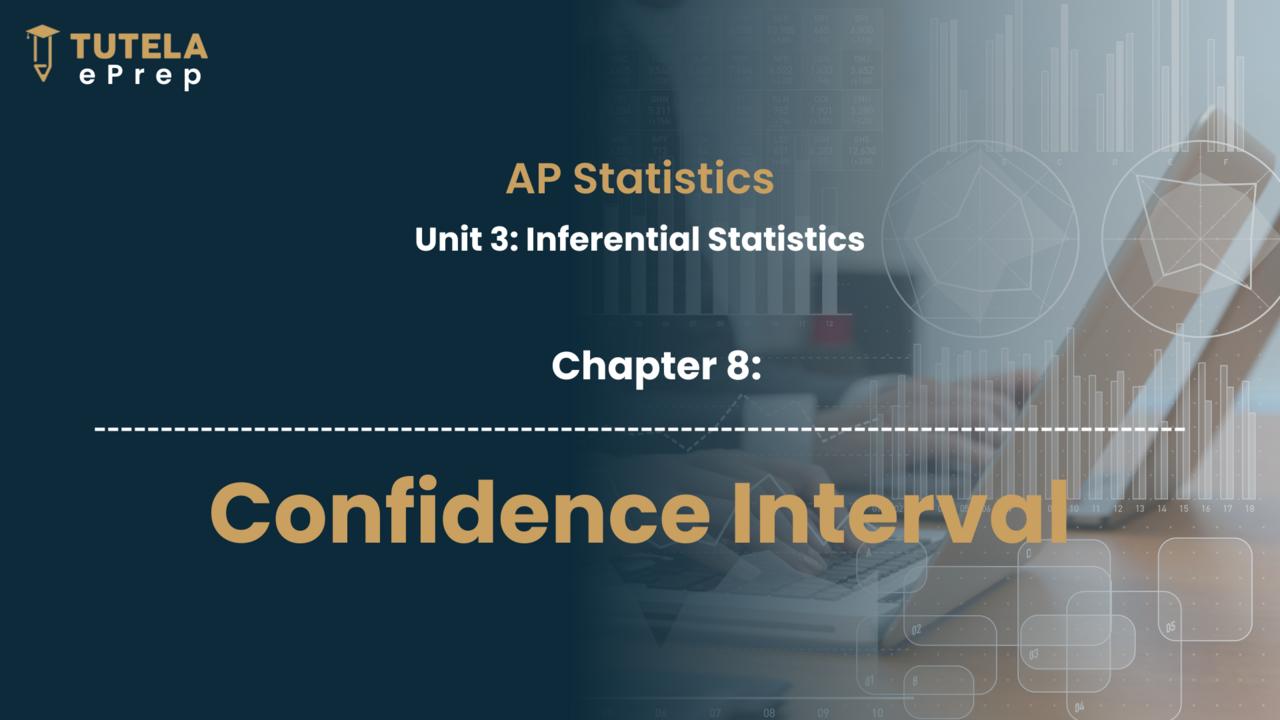
This chapter explains confidence intervals, including key concepts like point estimates, margin of error, and confidence levels. It discusses how to calculate and interpret confidence intervals for population proportions and means, using z-scores and t-distributions. Practical examples and calculator steps for constructing confidence intervals are provided.
This Chapter contains a Worksheet
Total Questions: 22
MCQ: 15
FRQ: 7
Start Chapter
![]() Class Notes
Class Notes
Purchase the course to proceed
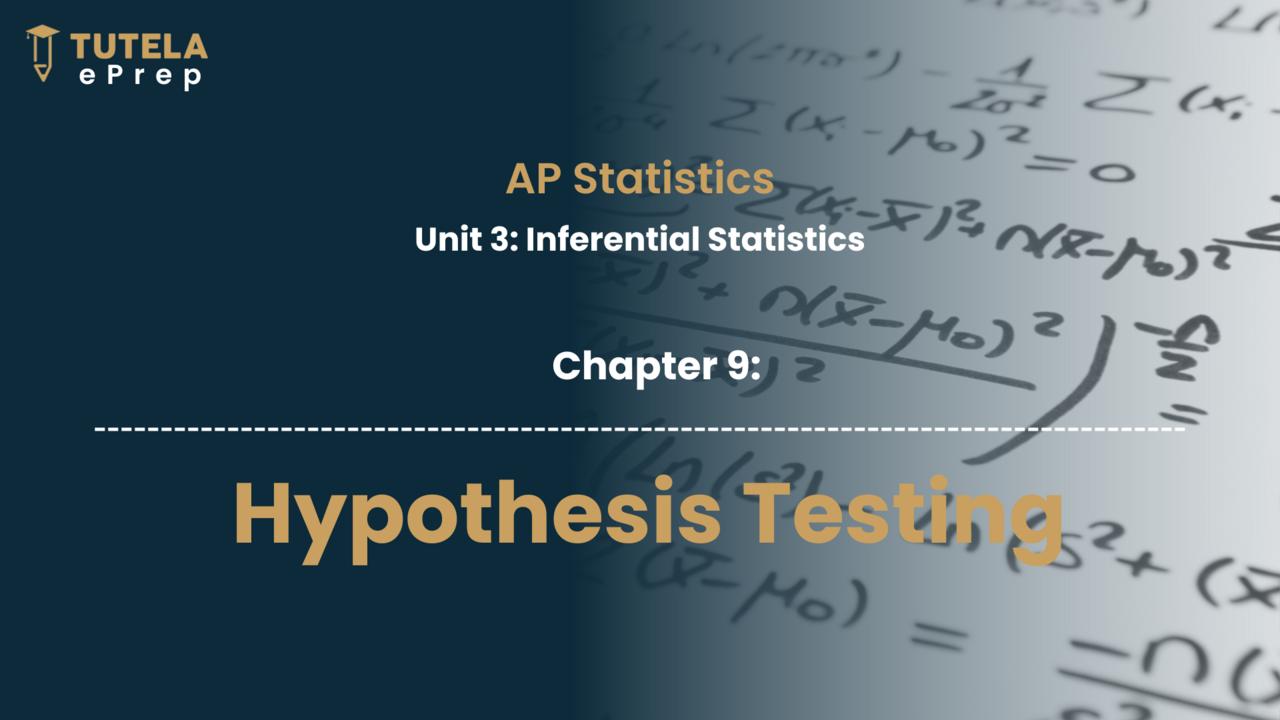
This chapter covers hypothesis testing, explaining the process of testing claims about population parameters using sample data. It introduces key concepts such as null and alternative hypotheses, p-value, and significance level. The chapter also discusses various tests, including one-proportion z-test, one-sample z/t-test, and paired data tests, and addresses potential errors and the power of a test.
This Chapter contains a Worksheet
Total Questions: 24
MCQ: 15
FRQ: 9
Start Chapter
![]() Class Notes
Class Notes
Purchase the course to proceed

This chapter explains how to compare two populations by analyzing the difference in population proportions and means. It covers constructing confidence intervals and conducting hypothesis tests for these comparisons, detailing necessary conditions such as random sampling, 10% condition, and normal approximation. Practical examples and scenarios illustrate these statistical methods.
This Chapter contains a Worksheet
Total Questions: 21
MCQ: 16
FRQ: 5
Start Chapter
![]() Class Notes
Class Notes
Purchase the course to proceed
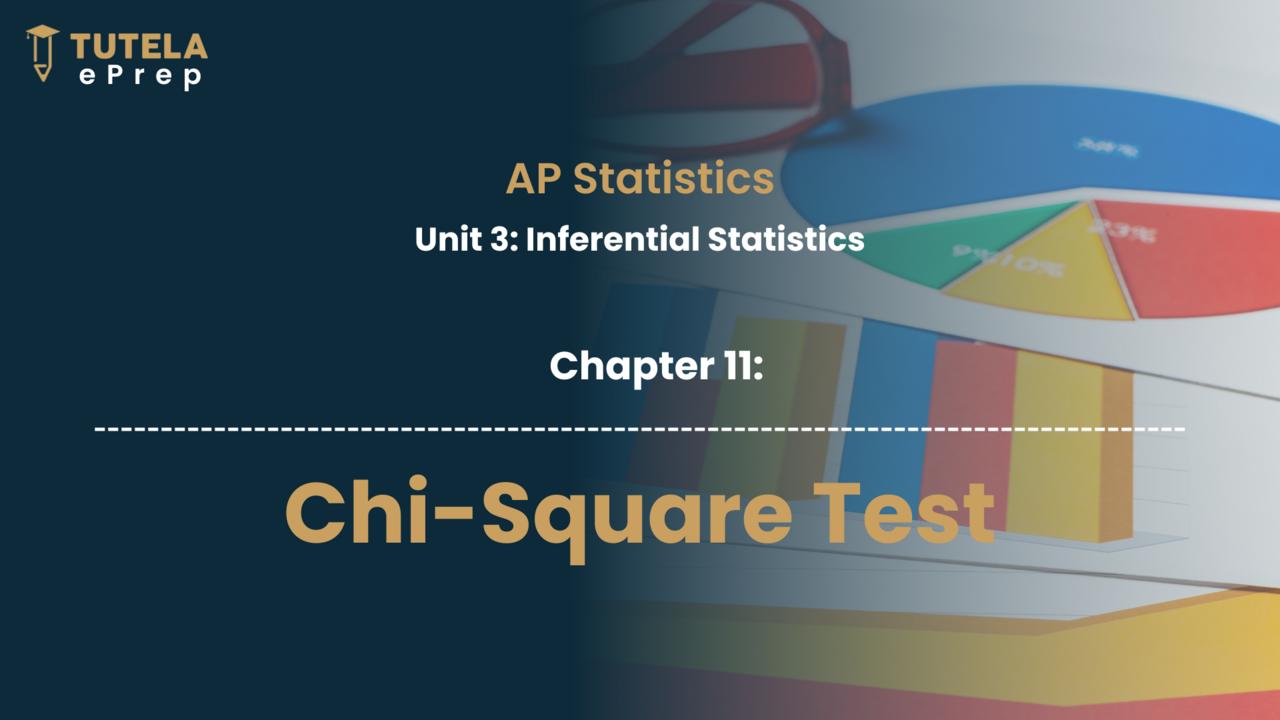
This chapter covers the Chi Square test, a significance test for categorical variables. It explains three types of Chi Square tests: goodness of fit, homogeneity, and independence. Each test assesses different aspects of categorical data distributions, with conditions for validity and practical steps for calculations using a calculator.
This Chapter contains a Worksheet
Total Questions: 20
MCQ: 15
FRQ: 5
Start Chapter
![]() Class Notes
Class Notes
Purchase the course to proceed
This chapter focuses on making inferences for regression, including the sampling distribution of sample slopes, conditions for inference, and constructing confidence intervals for the population regression line slope. It also covers hypothesis testing for the population regression slope, using statistical outputs from regression analysis to make informed decisions.
This Chapter contains a Worksheet
Total Questions: 14
MCQ: 12
FRQ: 2
Start Chapter
![]() Class Notes
Class Notes
FLT 1: AP Statistics
Purchase the course to proceed
Section I
Multiple Choice Questions
Duration: 45mins
Total Questions: 40
Section II
Free Response Questions: Part A
Duration: 65mins
Total Questions: 5
Free Response Questions: Part B
Duration: 25mins
Total Questions: 1
FLT 2: AP Statistics
Purchase the course to proceed
Section I
Multiple Choice Questions
Duration: 90mins
Total Questions: 40
Section II
Free Response Questions Part-A
Duration: 65mins
Total Questions: 5
Free Response Questions Part-B
Duration: 25mins
Total Questions: 1
FLT 3: AP Statistics
Purchase the course to proceed
Section I
Multiple Choice Questions
Duration: 90mins
Total Questions: 40
Section II
Free Response Questions Part-A
Duration: 65mins
Total Questions: 5
Free Response Questions Part-B
Duration: 25mins
Total Questions: 1
FLT 4: AP Statistics
Purchase the course to proceed
Section I
Multiple Choice Questions
Duration: 90mins
Total Questions: 40
Section II
Free Response Questions Part-A
Duration: 65mins
Total Questions: 5
Free Response Questions Part-B
Duration: 25mins
Total Questions: 1